Due Friday November 1 2024 (on paper at start of class, unless alternate arrangements have been made in advance)
Point values are indicated for each question.
Total points: 40
Question 1
5 points
(Problem 4.13 of the text)
A private pilot correctly sets her altimeter to reflect a reported altimeter setting of 1012 mb at her departure airport. She then climbs to an indicated cruising altitude of 1000 m above sea level. The highest terrain elevation between her and her destination is 850 m above sea level, which yields a fairly comfortable margin of 150 m. However, she does not realize that she is flying into an approaching low pressure system and that the correct altimeter setting will decrease to 992 mb well before she reaches her destination.
a) (4 points) If she fails to update her altimeter, what will her actual altitude margin be in the worst case as she crosses the highest terrain?
b) (1 points) Explain why you think that standard procedures require altimeter settings to always be rounded down.
Question 2
6 points
(Based on Problem 5.1 of the text)
A sample of dry air has an initial pressure hPa and temperature K. It undergoes a process that takes it to a new pressure hPa with unchanged temperature . Compute the mechanical work per unit mass performed by the sample under the following scenarios:
a) (1.5 points) Isochoric pressure reduction to followed by isobaric expansion to final state.
b) (1.5 points) Isobaric expansion to final specific volume followed by isochoric pressure reduction to final state.
c) (3 point) Isothermal expansion to final state.
Question 3
3 points
(Problem 5.2 of the text)
From what you know about the design of the skew-T diagram and about the Ideal Gas Law, state whether a closed clockwise path on this diagram represents positive or negative work done by a parcel. Explain your reasoning, e.g., by pointing out how a specified cycle on an diagram would appear on a skew-T diagram.
Question 4
6 points
(Problem 5.3 of the text)
A typical scuba tank has a volume of 10 liters. When fully charged, it contains compressed air at a pressure of 200 bars, or Pa.
a) (2 points) What is the uncompressed volume of the air if the ambient pressure is 1000 hPa and the temperature is 293 K for both the compressed and uncompressed air?
b) (3 points) How much mechanical work in joules is required to fill the tank, if the process is isothermal? Hint: Recall that the pressure will be a function of , and consider starting and ending volumes as your limits of integration.
c) (1 point) If the compressor is able to deliver 1000 W of average power, how long does it take to fill the tank?
Question 5
12 points
(Problem 5.4 of the text)
For each of the following conditions, compute (i) the mechanical work done by a sample of dry air, and (ii) the heat added to the sample.
a) (3 points) Isothermal compression to one-fifth of its original volume at 15ºC.
b) (3 points) Isobaric heating from 0ºC to 20ºC.
c) (3 points) Isochoric heating from 0ºC to 20ºC.
d) (3 points) Adiabatic expansion to five times its original volume, with initial temperature of 20ºC.
Question 6
4 points
(Problem 5.6 of the text)
A transcontinental airliner cruises at an altitude of approximately 12 km, where the temperature may be -55ºC and the pressure is approximately 200 hPa.
a) (1 point) Compute the potential temperature of the air at this altitude.
b) (3 points) Cabin pressure is typically maintained at about 750 hPa, corresponding to a pressure altitude of about 2,400 m. When the outside air is compressed adiabatically to to the cabin pressure, compute the air temperature (in Celsius and Fahrenheit) that would result if no corrective action were taken.
Question 7
4 points
(Based on Problem 5.7 of the text)
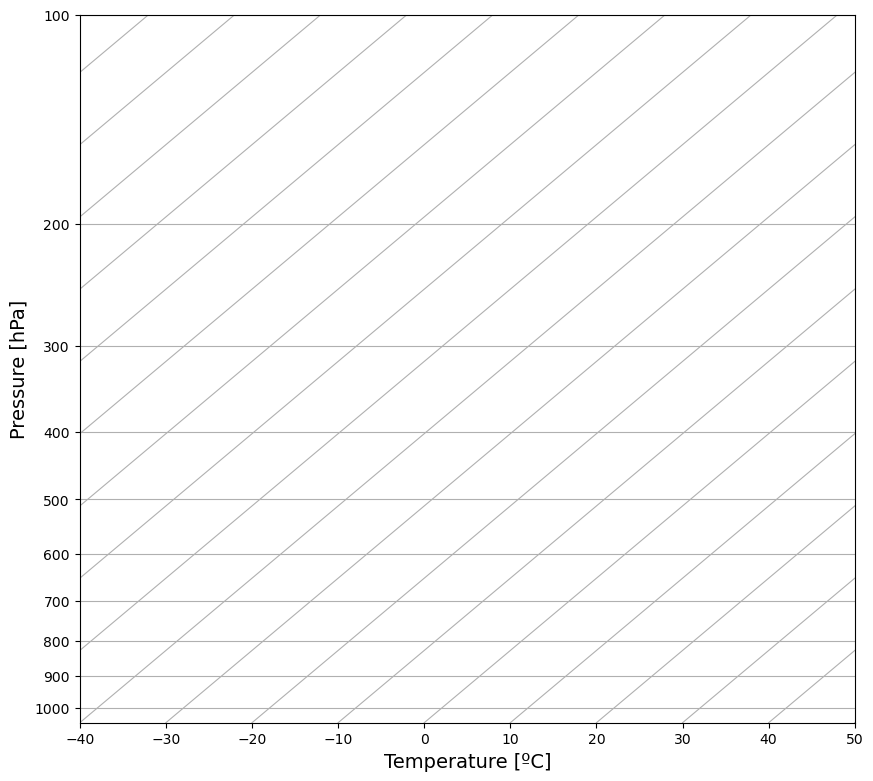
For a potential temperature of K, compute the corresponding temperature at 700 hPa, 300 hPa, and 100 hPa. Plot your results at the appropriate locations on the skew-T diagram below, and sketch in the corresponding dry adiabat.
You can ignore the code here! It’s just used to generate the blank chart that I want you to plot on by hand.
import matplotlib.pyplot as plt
from metpy.plots import Hodograph, SkewT
fig = plt.figure(figsize=(10, 14))
skew = SkewT(fig, rotation=50)
skew.ax.set_xlabel('Temperature [ºC]', fontsize=14)
skew.ax.set_ylabel('Pressure [hPa]', fontsize=14);