Brian E. J. Rose, University at Albany
This document is part of a collection of material for the graduate course ATM 623: Climate Modeling. At some point this content may be merged into The Climate Laboratory book.
Instructions
The purpose of this assignment is two-fold:
Get you familiar with doing orbital and insolation calculations with climlab
Introduce you to some modern twists on the Astronomical Theory of the ice ages.
As always, make sure of all the following
You answer all the questions, including discussion
Your notebook is well organized and clear
Your code runs cleanly from start to finish
You save your notebook as
[your last name].ipynb
Submit your notebook by email before class on Wednesday April 9 2025.
Early Pleistocene Glacial Cycles and the Integrated Summer Insolation Forcing
Although the causes of the ice ages have been discussed for over 150 years, there are still many unsolved problems.
Go back and look at the timeseries of global ice volume we showed in Section 1 of the notes on Orbital variations
The most recent glaciations (the “Late Pleistocene”) have been large in amplitude and occur on a roughly 100 kyr timescale. The earlier glaciations were smaller in magnitude and occurred on shorter 40 kyr timescales -- apparently in sync with obliquity variations.
One very big outstanding question is this:
Why did the dominant frequency for the ice ages change from 40 kyr to 100 kyr roughly 800 kyr ago?
We are not going to answer that here. There is, however, a very nice clear explanation for the obliquity-pacing of the Early Pleistocene.
This has been presented in a nice 2006 paper by Peter Huybers.
First, read the paper.
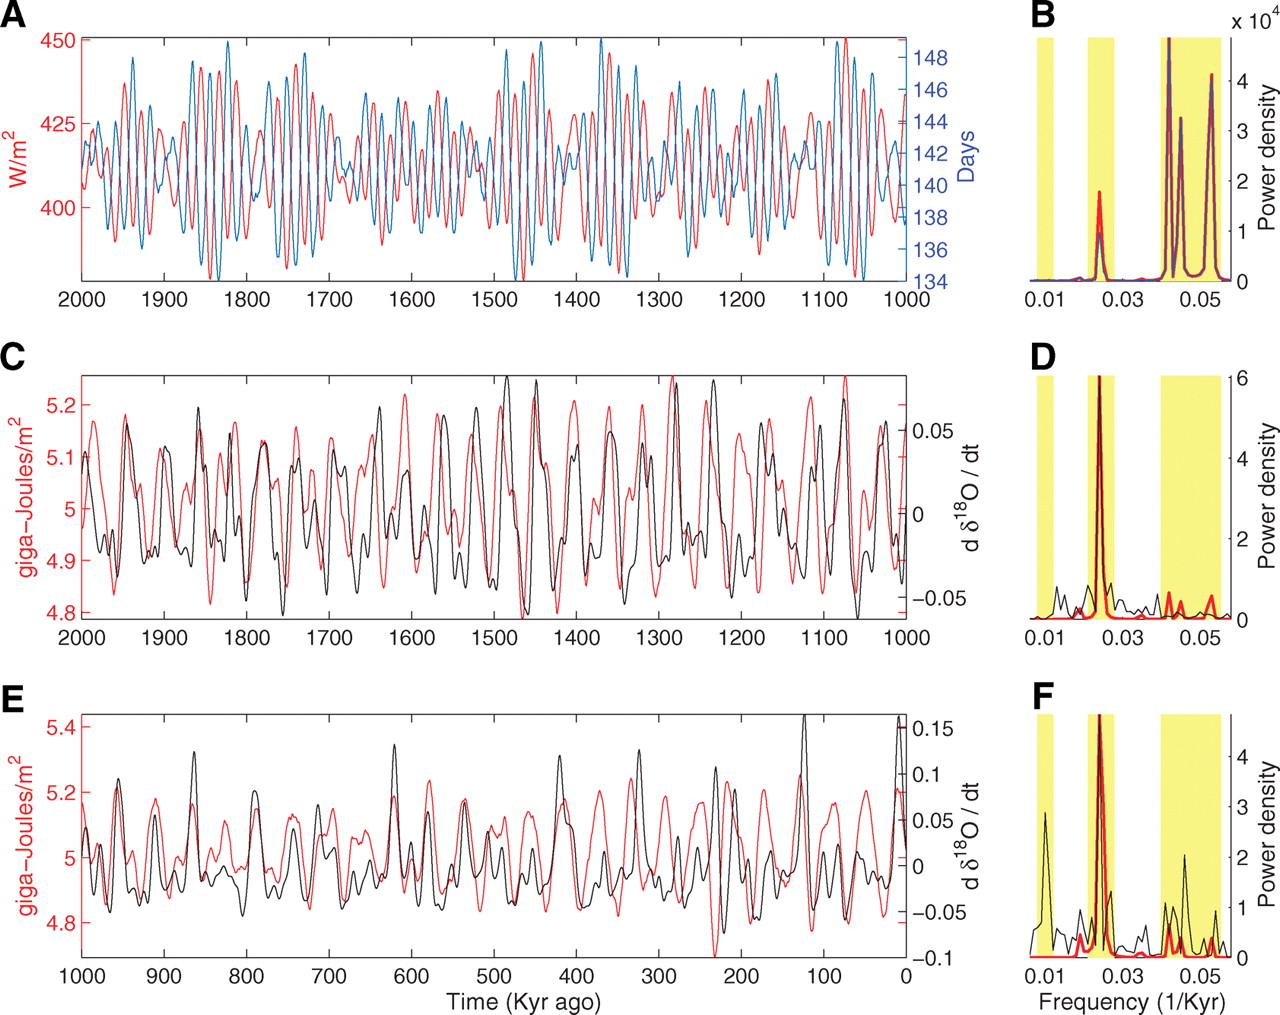
Figure 2 of Huybers, 2006 is reproduced here:

Fig. 2. Insolation forcing and Pleistocene glacial variability. (A) Number of days that insolation is above 275 W/m2 (blue) and the average insolation intensity during this interval (red). Intensity and duration are anticorrelated. (B) Spectral estimate of the duration (blue) and intensity (red), showing that the majority of the variability is at the precession periods. Shaded bands from left to right indicate the 100-ky, 41-ky (obliquity), and 21-ky (precession) bands. (C) Summer energy (red) and the time rate of change of δ18O (black) for the early Pleistocene and (D) the corresponding spectral estimates. Positive rates of change indicate decreasing ice volume. Variability in both records is predominantly at the 41-ky obliquity period. (E and F) Same as (C) and (D) but for the late Pleistocene. The time rate of change of δ18O has variability at the 100-ky period not present in the forcing.
Your assignment
Your tasks is to reproduce these orbital / insolation calculations using the climlab tools. Specifically:
Reproduce the blue curve in Fig. 2A: number of days per year that insolation is above 275 W m at 65ºN, between 2000 and 1000 kyrs before present.
Reproduce the red curve in Fig. 2C: Integrated summer insolation: the total accumulated insolation for every day for which this insolation is above the threshold of 275 W m.
Reproduce the red curve in Fig. 2A: Average summer insolation intensity. This is the integrated summer insolation above the intensity threshold divided by the number of seconds during which the insolation threshold is exceeded. (Preferably plot this on the same graph as the number of days to reproduce Fig. 2A completely).
- Huybers, P. (2006). Early Pleistocene Glacial Cycles and the Integrated Summer Insolation Forcing. Science, 313(5786), 508–511. 10.1126/science.1125249